Keep the business question in view.
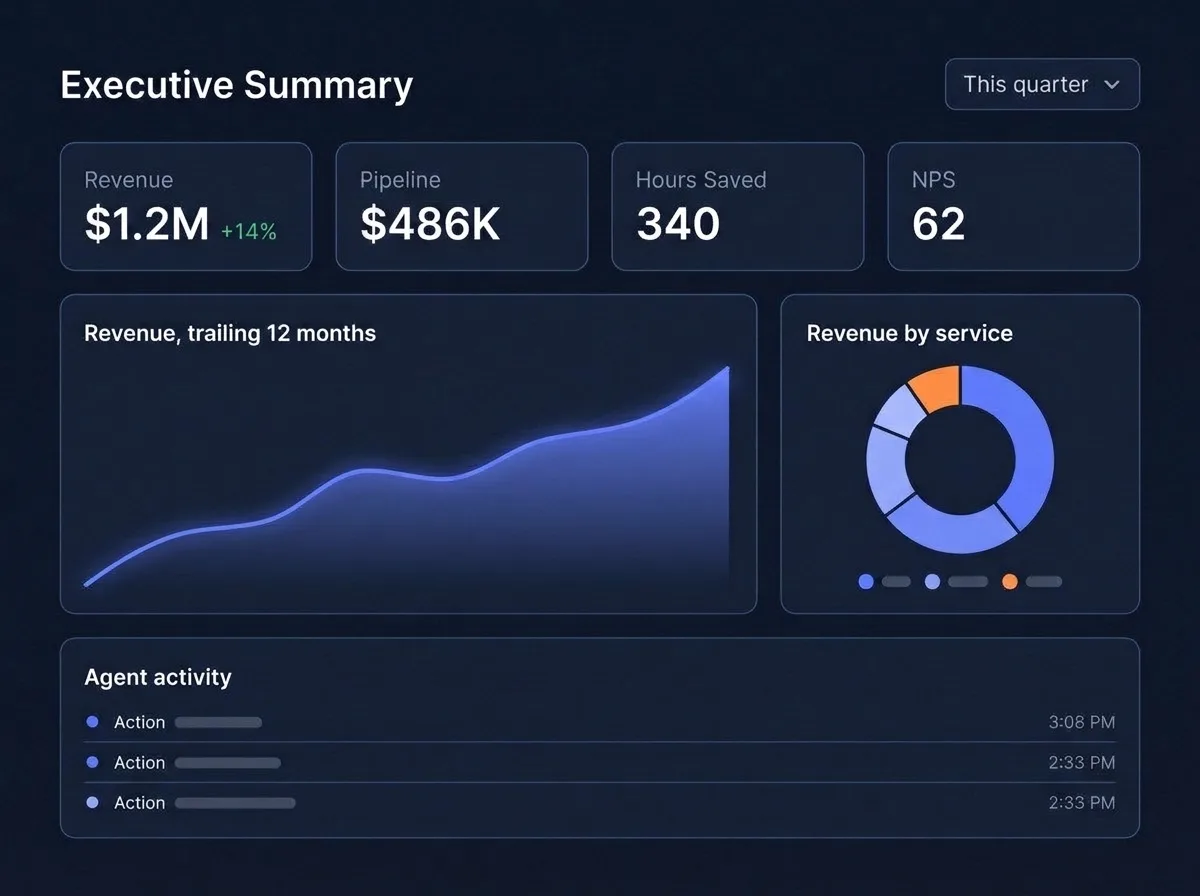
One page for the leadership team: the growth measures you agreed, the pipeline and what matters commercially.
Dashboards
Dashboards built around the decisions your team has to make, with your marketing data in one place and every number defined once.
Book a free auditWhat changed? Is the source reliable? Where should we look next? What needs a decision?
A useful dashboard puts the context next to the number so the next step is obvious.
Try the example
Move between channels and open the definitions behind each number. We build dashboards around the questions your team asks.
Sessions by week
Same metric. Shared definition.Sessions are analytics visits. A qualified lead is a form submission meeting the agreed qualification rules. Lead conversion divides qualified leads by sessions. Definitions and attribution are agreed around the decisions your team needs to make.
| Channel | Sessions | Qualified leads | Cost per lead |
|---|---|---|---|
| Paid search | 12,460 | 318 | $42.30 |
| Organic search | 18,240 | 276 | Not attributed |
| Paid social | 9,820 | 184 | $58.70 |
| 4,680 | 142 | Not attributed |
Check what changed, confirm the source, then decide what to do next.
This is a working example. The numbers show how it works; they are not client results.
Each dashboard is shaped by who uses it, what data you have and what they need to do with it.
One page for the leadership team: the growth measures you agreed, the pipeline and what matters commercially.
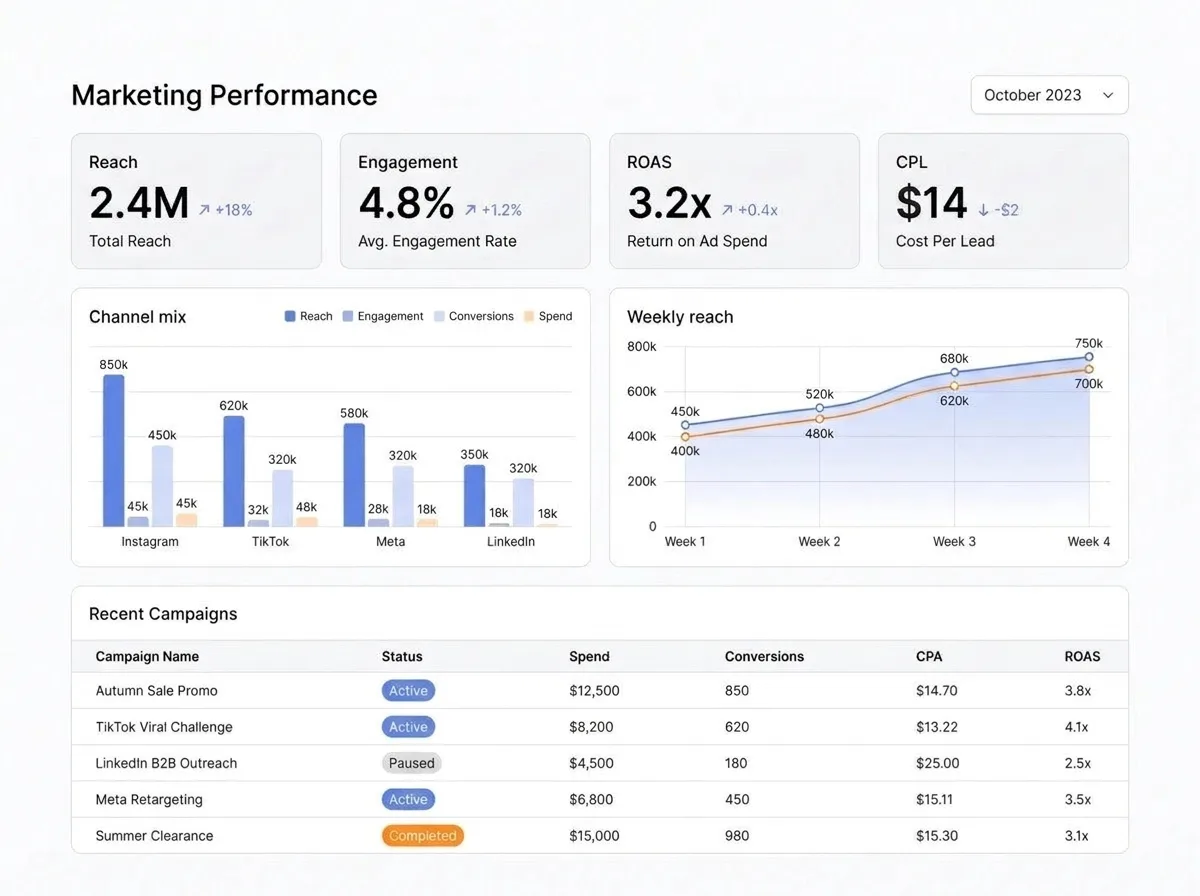
Every channel, the conversion definitions and the qualified results together, with enough context to investigate a change.
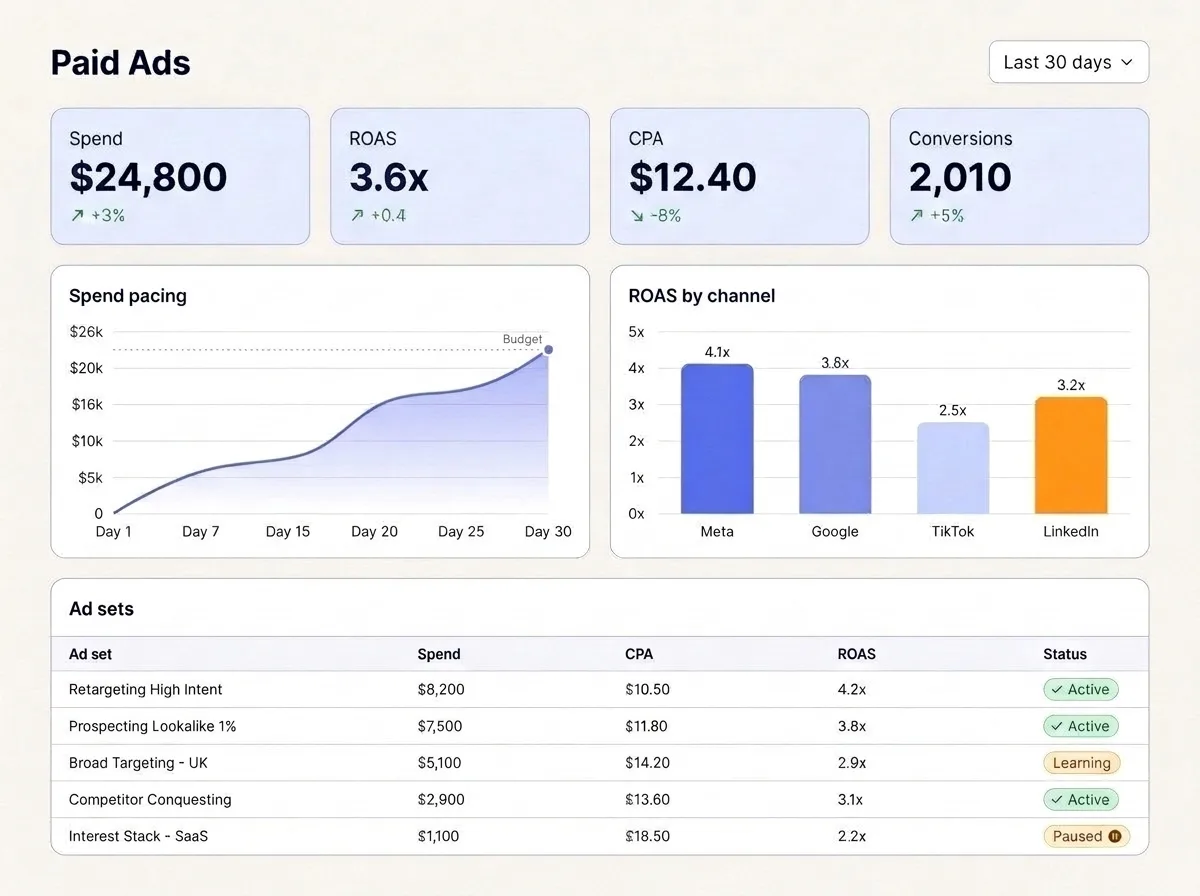
Spend, delivery, creative and results in one view, with who controls the budget and the limits of attribution kept visible.
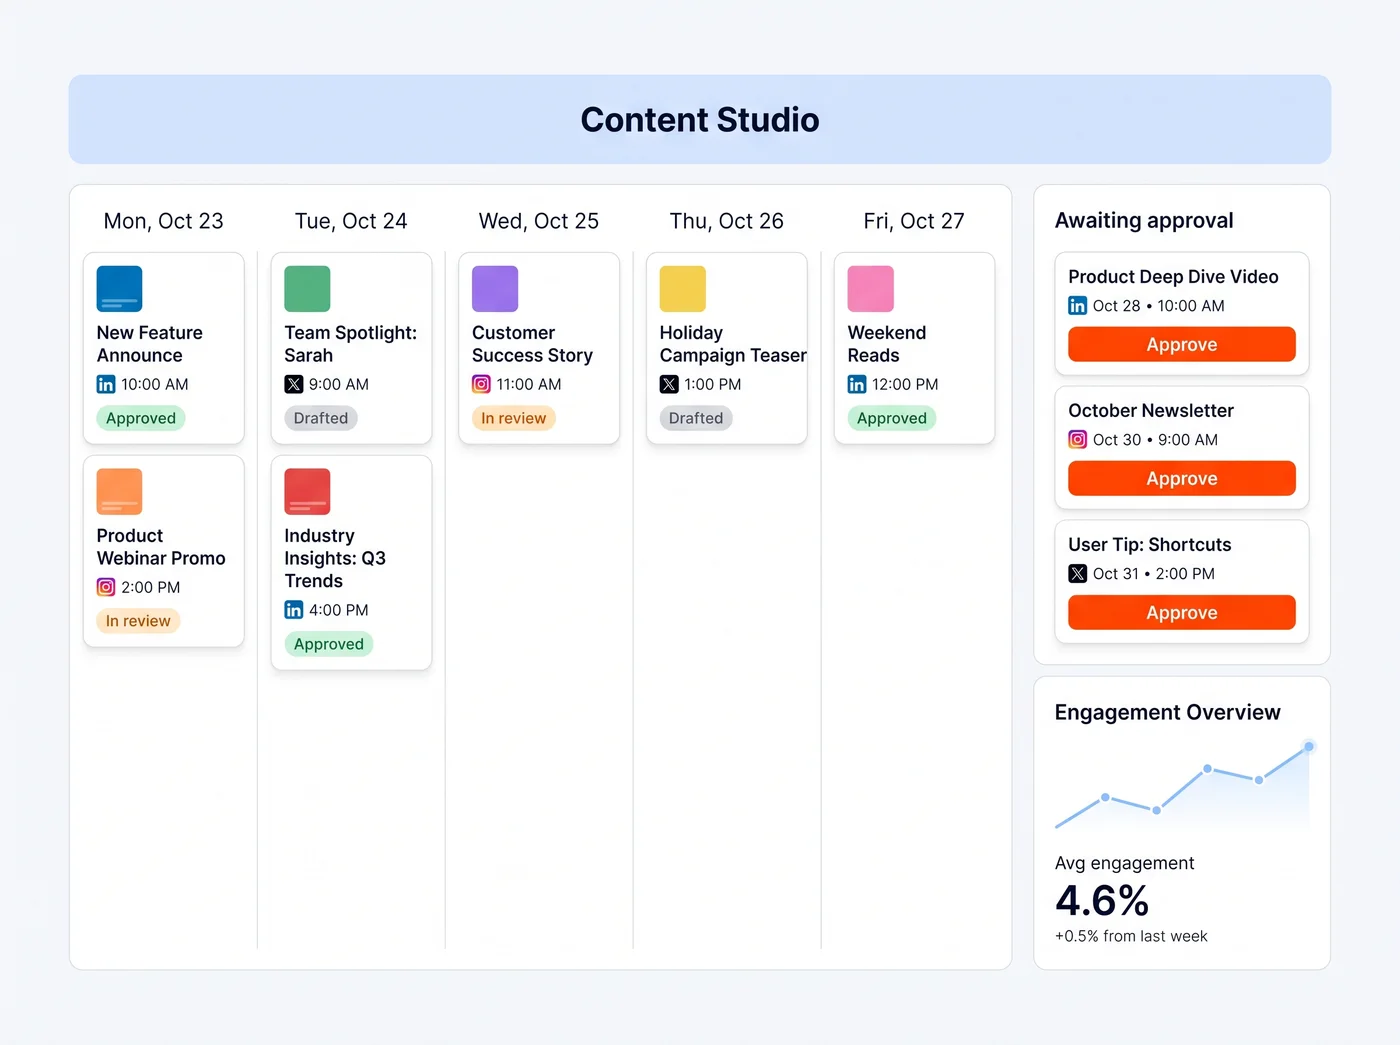
Output, distribution and audience response next to the brief and the purpose of each piece.
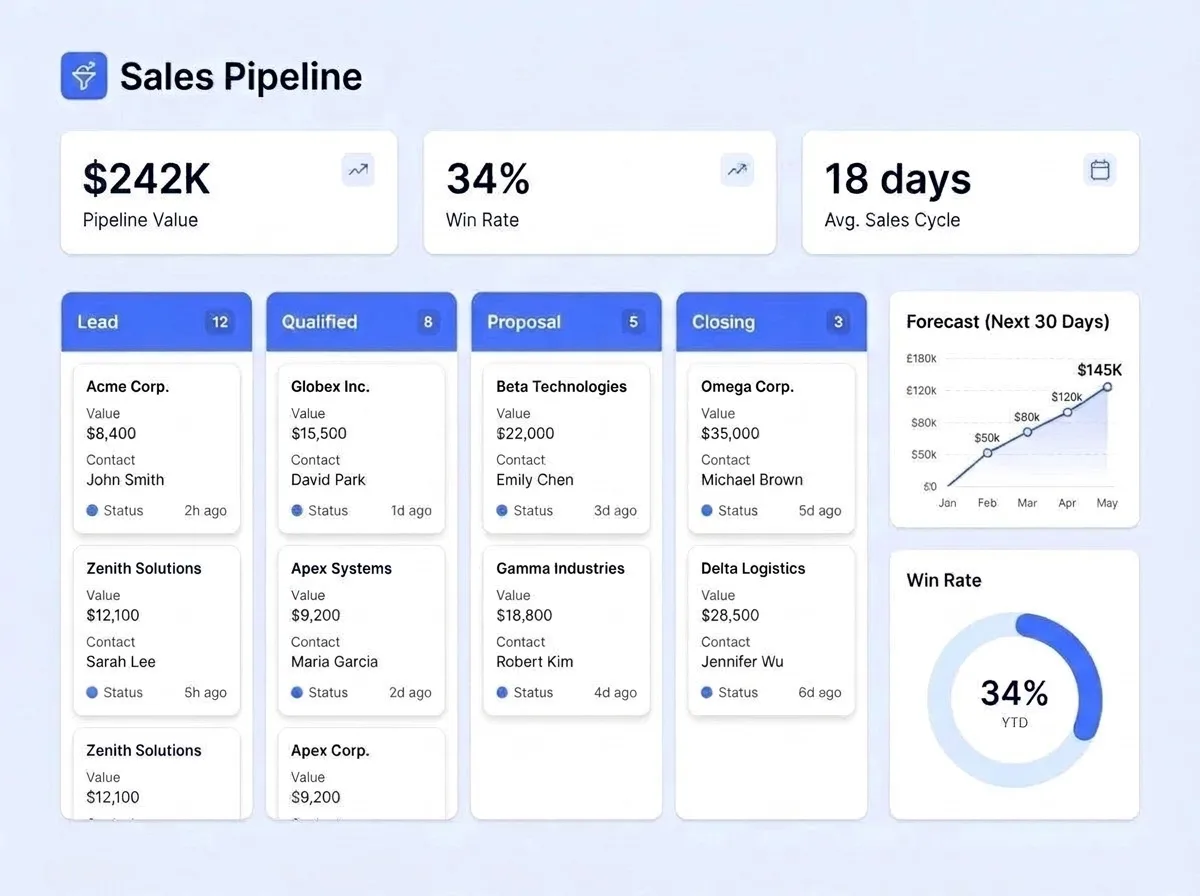
Follow leads through the stages you agreed, with their source and the sales context, and see where qualification or routing is leaking.
Engagement, lifecycle movement and customer signals, clearly defined and only visible to the people who should see them.
How your AI systems are doing: test results, review queues, usage and failures, each with a named owner.
We start with who needs it, what they are asking, what data exists and what they will do with the answer, then shape the view around that.
Advertising, analytics, CRM and the systems your team already uses.
How fresh it is, whether it is right, where it came from and what the number means.
A dashboard, a question and a person who owns the next move.
A polished chart cannot fix conflicting definitions or unreliable inputs, so we build the data foundation as part of the dashboard.
See data engineering